


Maps for Blazor is a library that provides components for displaying maps in Blazor applications. It supports various map providers (currently Esri and Leaflet) and allows developers to easily integrate interactive maps, without any JavaScript settings, into their Blazor projects. One code, one blazor component and many technologies.
KEYWORDS: Minimizing Invoke callers to JavaScript, No JavaScript specific settings, no script references, no css links. One code, one component many technologies.
| New Examples | Sample Image |
|---|---|
| SigmaDrone code examples | 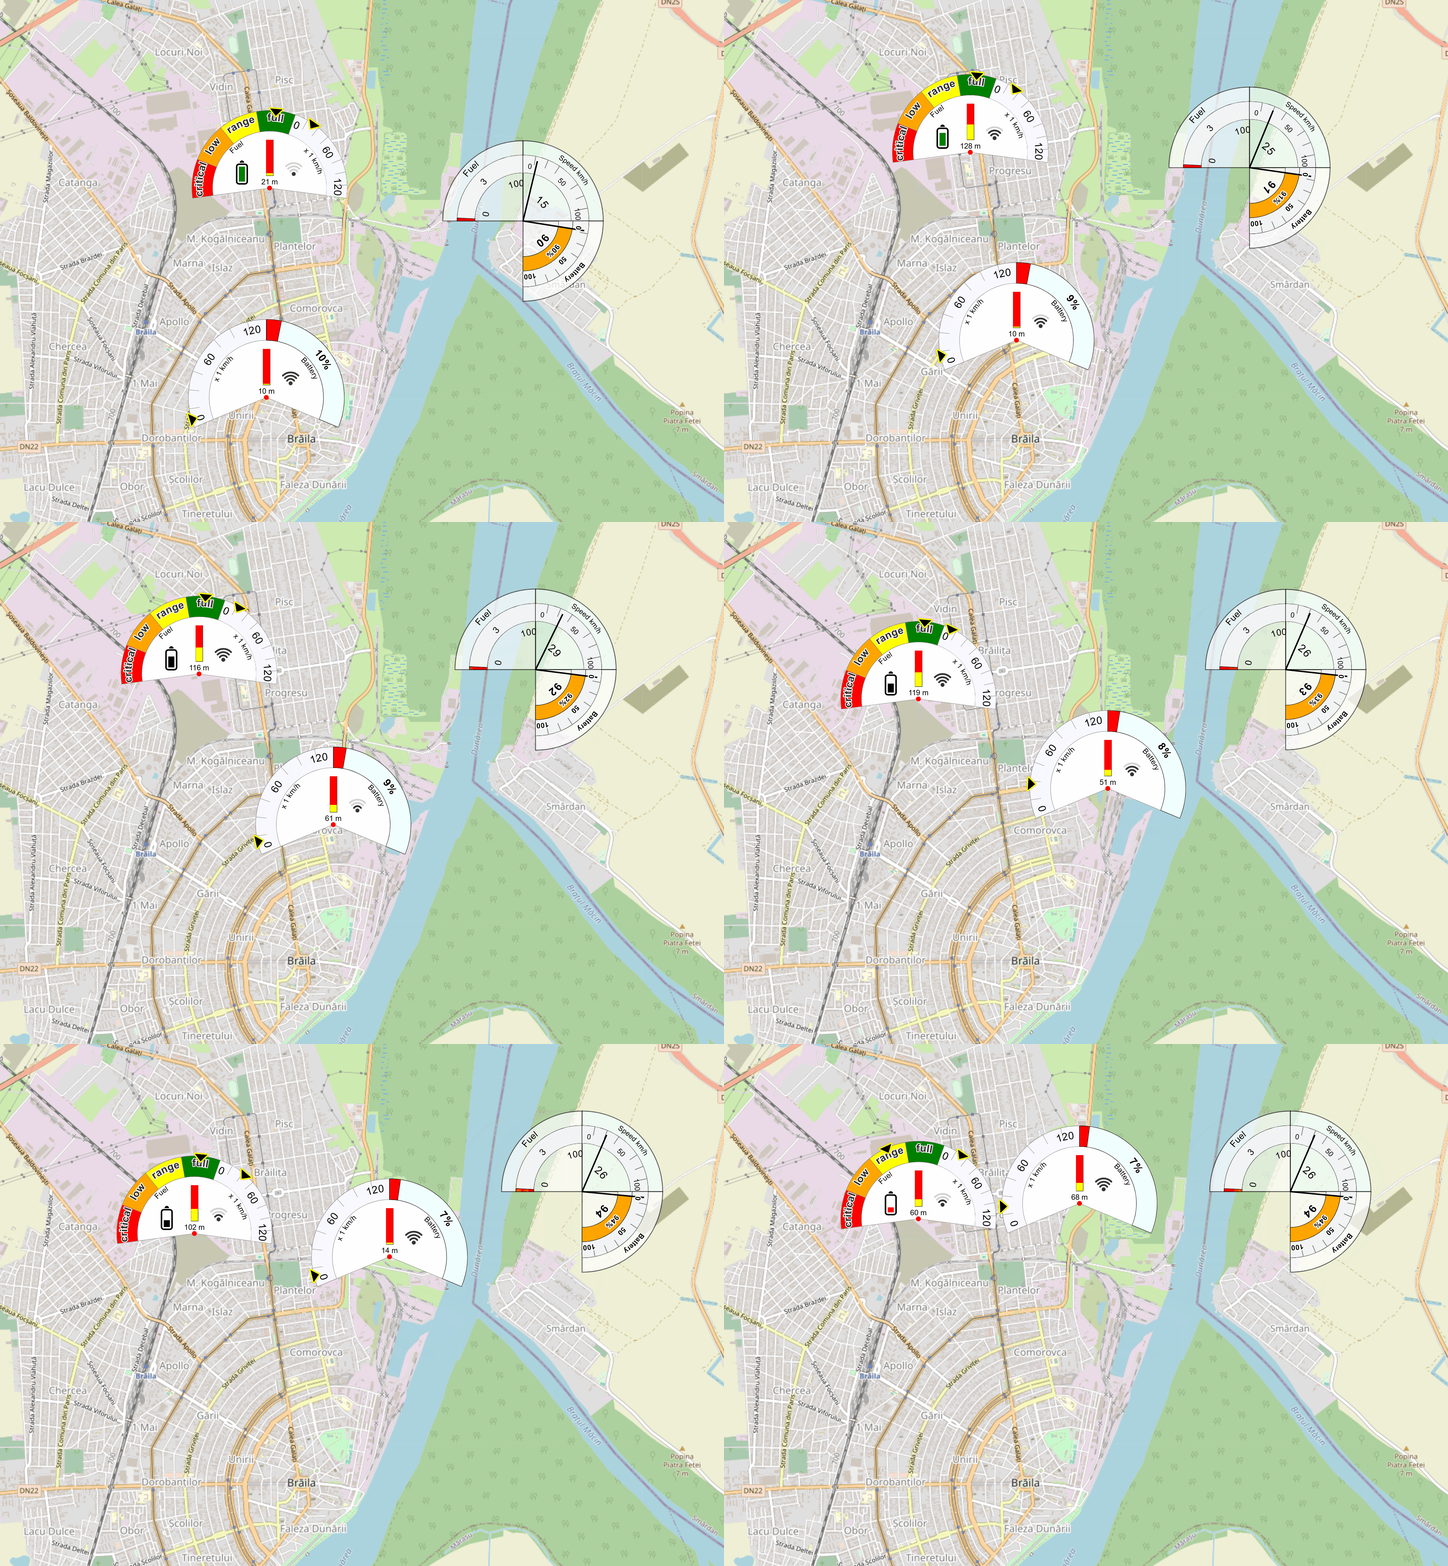 |
Core Concepts
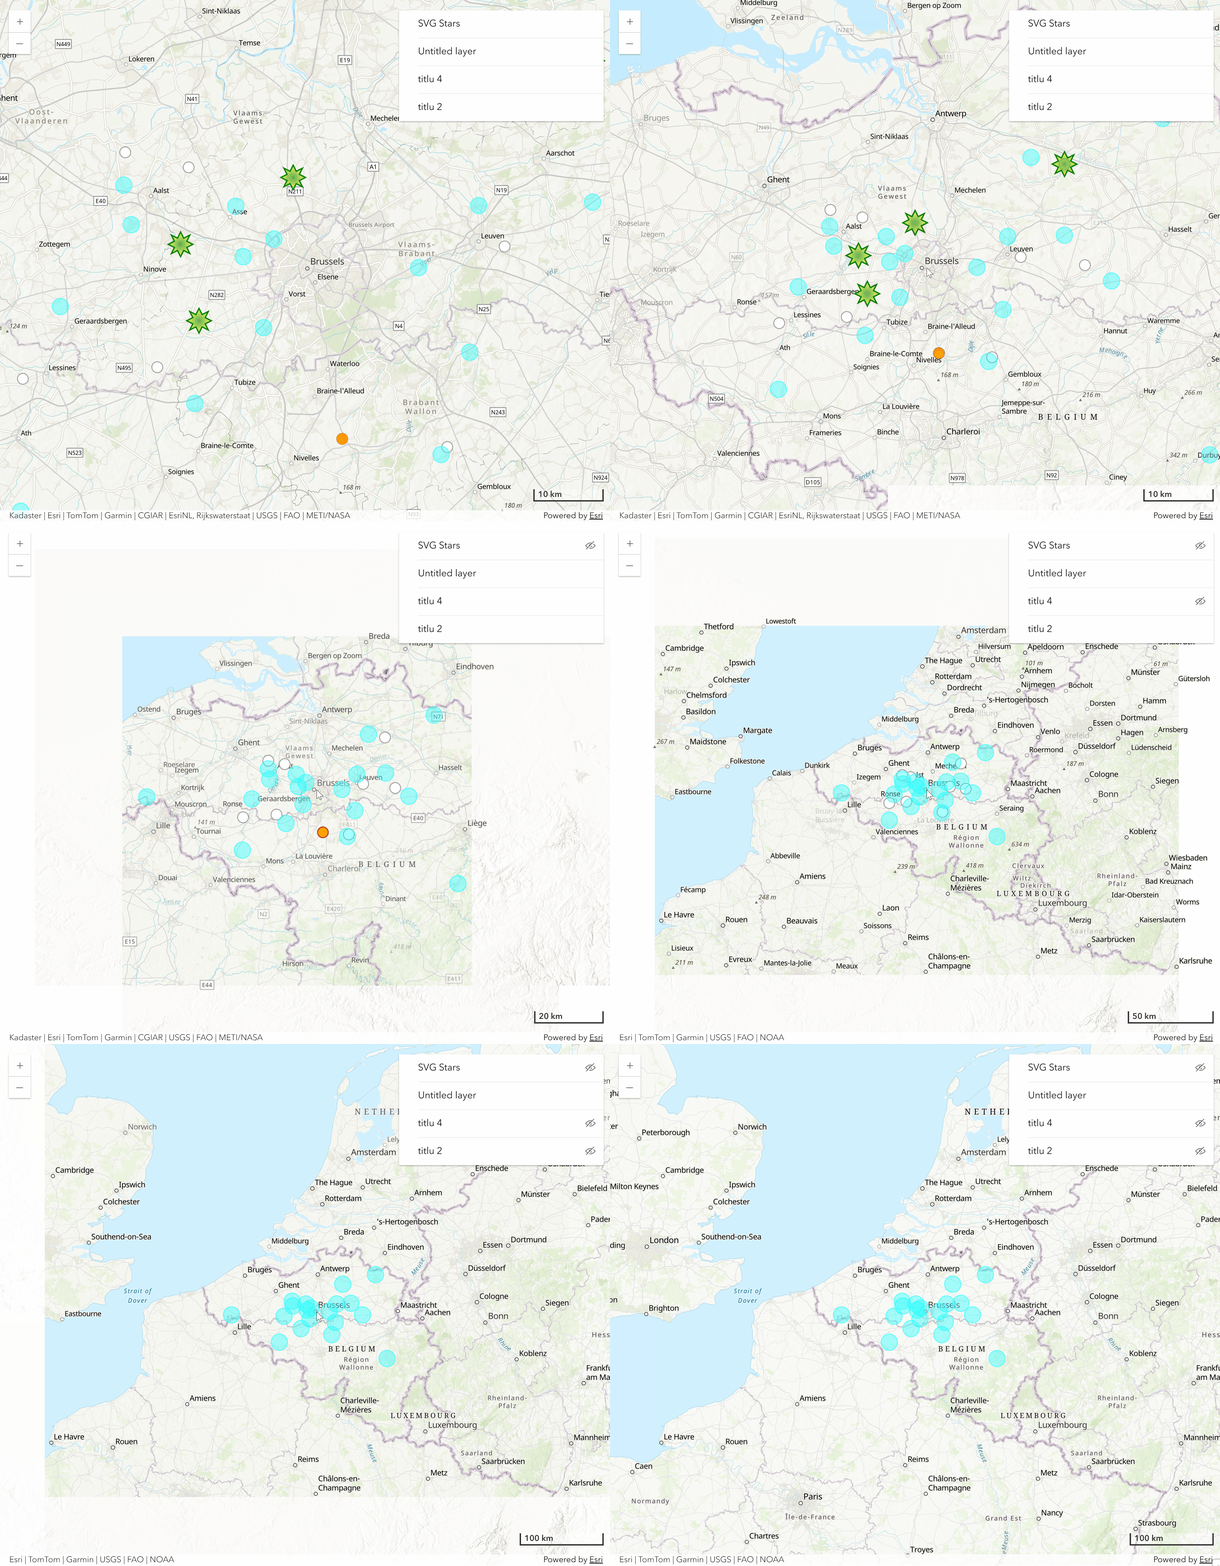
You can display the map in the blazor page using one of the provided technologies (currently Esri and Leaflet). Regardless of the technology provider (Esri, Leaflet), the code for implementing the map will be the same.
| ArcGIS | Leaflet |
|---|---|
 |
 |
@using static MapsForBlazor.techs.maps.ArcGIS |
@using static MapsForBlazor.techs.maps.Leaflet |
No JavaScript specific configurations required, no API script configurations, no CSS references, etc.One code, one component, many technologies.Optimized codethrough various solutions- minimizing the number of calls to JavaScript;
- collection searches by destructuring and structuring LINQ expressions
Quick Start
Basic configuration
🔵 Add the right map and technology to your project in just 3 steps:
- add MapsForBlazor NuGet package:
Using Visual Studio interface:
- Tools -> NuGet Package Manager -> Manage NuGet Packages for Solution...
Search for "MapsForBlazor" and add the package to the project or solution.
Or using Visual Studio console:
-
Tools -> NuGet Package Manager -> Package Manager Console
NuGet\Install-Package MapsForBlazor
-
add the MapsForBlazor namespace to the project, using the @using directive
To do this, add the following directives to the _Imports.razor file
@using MapsForBlazor
@using static MapsForBlazor.Map
- Configuring the Blazor page (which will host the Map control):
The @using directive allows selecting the API for generating the map:
@using static MapsForBlazor.techs.maps.ArcGIS //ArcGIS
Or:
@using static MapsForBlazor.techs.maps.Leaflet //Leaflet
🔵 The following code is the same (identical) regardless of the namespace chosen (whether you chose MapsForBlazor.techs.maps.ArcGIS or whether you chose MapsForBlazor.techs.maps.Leaflet). |
|---|
Map
Adding the map to the blazor page:
<Map height="calc(100vh - 1rem)" width="calc(100vw - 2rem)"/>
Load Parameters
The default (loading) parameters of the map can be configured using the loadParameters parameter of the Map component.
Blazor Page
for ArcGIS:
@using static MapsForBlazor.techs.maps.ArcGIS //for ArcGIS Maps SDK
<Map loadParameters="@loadParameters" height="calc(100vh - 1rem)" width="calc(100vw - 2rem)"/>
for Leaflet:
@using static MapsForBlazor.techs.maps.Leaflet //for Leaflet
<Map loadParameters="@loadParameters" height="calc(100vh - 1rem)" width="calc(100vw - 2rem)"/>
Code Block
@code{
   LoadParameters loadParameters = new LoadParameters()
    {
        location = new Location()
        {
            latitude = 50.870847591747186,
            longitude = 4.257255449993001
        },
        zoomLevel = 10,
        mapControls = new MapControls()                                         //the controls to be displayed on the map
        {
            layerList = new LayerList() { position =  Position.bottomRight },   //layer list control
            scaleBar = new ScaleBar() {                                         //scale bar control
                position = Position.bottomRight,
                unitOfScaleBar = UnitOfScaleBar.metric
            },

        }
    };
}
Points on the map
To optimize rendering, MapsForBlazor operates with a predefined data structure for points.
public class StreamPoint
{
    public Guid guid { get; set; }
    public Coordinates coordinates { get; set; }
    public object value { get; set; }
    public DateTime timestamp { get; set; }
    public string? type { get; set; }
}
| 🔵 This structure can be extended, using custom data structures, for the value parameter. |
|---|
Data addition flow
Loaded event
To add points to the map it is important that the map is already initialized. The first event that is triggered after the map is initialized is OnAfterMapLoaded.
Event initialization:
🔹Blazor Page:
<Map height="calc(100vh - 1rem)" width="calc(100vw - 2rem)" OnAfterMapLoaded="@OnAfterMapLoaded"/>
🔹Code Block:
@code {
        private async Task OnAfterMapLoaded(MapEventArgs args)
        {

        }
    }
Adding points
To add points to the map, you can use the Add method of the Map component. This method accepts a list of StreamPoint objects.
🔹Blazor Page:
<Map height="calc(100vh - 1rem)" width="calc(100vw - 2rem)" OnAfterMapLoaded="@OnAfterMapLoaded"/>
🔹Code Block:
@code {
        private async Task OnAfterMapLoaded(MapEventArgs args)
        {
             await map.Geometric.Points.Add(new List<StreamPoint>(){});
        }
    }
Removing
await map.Geometric.Points.Remove();
Update
You can update both the attributes and the point position (coordinates):
await map.Geometric.Points.Update(new List<StreamPoint>(){});
OnClick Event
The points collection provides the OnClick event that allows you to return the points near which the click was made on the map. The distance to search for points, from the point where the click was made, is one hundredth of the diagonal of the visible area of the map.
    map.Geometric.Points.OnClick += async (object? sender, StreamPointEventArgs args) =>
   {
       Console.WriteLine($"    Clicked point with count {args.points.Count()}");
   };
Where:
    public class StreamPointEventArgs : EventArgs
    {
       public List<StreamPoint> points { get; set; }    //points near the point where the click was made
       public Coordinates geoid { get; set; }           //geographical coordinates of the point where the click was made
       public Coordinates screen { get; set; }          //screen coordinates of the point where the click was made
    }
Appearance
Appearance is a method that allows filtering and applying properties specific to the display of points on the map. Appearance supports the SetStyle() and SetPopup() methods. Here you can find more about Appearance().
Changing the appearance (Style) of the point on the map can be done using the following classes (SetStyle()): - PointStyle -> base class with which you can display predefined markers;
    public class PointStyle
    {
        public string title { get; set; } = "without title";
        public VisibilityZoomLevels visibilityZoomLevels { get; set; } = new VisibilityZoomLevels();
        public int radius { get; set; } = 4;
        public string? fillColor { get; set; }
        public string? color { get; set; }
        public int weight { get; set; } = 1;
        public double opacity { get; set; } = 1;
        public double fillOpacity { get; set; } = 1;
    }
- **DynamicPointSVG ** -> is a class with which you can use svg elements to display the point on the map. The DynamicPointSVG class defines a set of SVG elements that are scalable with the zoom level and are only displayed in the current view.
public class DynamicPointSVG
{
    public string title { get; set; } = "without title";
    public VisibilityZoomLevels visibilityZoomLevels { get; set; } = new VisibilityZoomLevels();
    public string? htmlContent { get; set; }
    public int dimension { get; set; }
    public int scaling { get; set; } = 100;
}
- PieChart -> is a class with which you can use pie charts to display the point on the map. The PieChart class defines a set of pie chart elements that are scalable with the zoom level and are only displayed in the current view.
public class PieChart: IChartPoint, IPieStyles
{
    public string title { get; set; } = "without title";
    public VisibilityZoomLevels visibilityZoomLevels { get; set; } = new VisibilityZoomLevels();
    public int dimension { get; set; }
    public int scaling { get; set; } = 100;
    public int  fontSize { get; set; } = 6;
    public int expandedIndex { get; set; } = -1;    //slice index to be expanded, -1 means no slice is expanded
    public PieStyle? styles { get; set; } = null;
    public object paramOrValues { get; set; }       //values for pie chart or parameter ${parameterValues}
    public object paramOrLabels { get; set; }       //labels for pie chart or parameter ${parameterLabels}
    public object paramOrColors { get; set; }       //colors for pie chart or parameter ${parameterColors}
}
-
GaugeChart -> is a class with which you can use gauge charts to display the point on the map. The GaugeChart class defines a set of gauge chart elements that are scalable with the zoom level and are only displayed in the current view.
public class GaugeChart : IGaugeChart { public string title { get; set; } = "without title"; public VisibilityZoomLevels visibilityZoomLevels { get; set; } = new VisibilityZoomLevels(); public int dimension { get; set; } = 28; public object paramOrValueStart { get; set; } public object paramOrValueStop { get; set; } public object paramOrValue { get; set; } public string label { get; set; } public string colorStart { get; set; } = "white"; public string colorStop { get; set; } = "white"; public string opacity { get; set; } = "white"; public int heightCircularCrown { get; set; } = 14; public string urlIndicator { get; set; } public string fontColorStart { get; set; } = "black"; public string fontColorMiddle { get; set; } = "black"; public string fontColorStop { get; set; } = "black"; public int fontSize { get; set; } = 6; public bool turnedAround { get; set; } = false; } -
DiscreteGaugeChart -> is a class with which you can use gauge charts to display the point on the map. The DiscreteGaugeChart class defines a set of gauge chart elements that are scalable with the zoom level and are only displayed in the current view.
      public class DiscreteGaugeChart :  IDiscreteGauge
      {
        public int dimension { get; set; } = 28;
        public VisibilityZoomLevels? visibilityZoomLevels { get; set; }
        public object paramOrColors { get; set; }
        public object paramOrPercentage { get; set; }
        public object paramOrLabels { get; set; }
        public object paramOrValue { get; set; }
        public string label { get; set; }
        public int fontSize { get; set; } = 8;
        public int index { get; set; } = -1;
        public int heightCircularCrown { get; set; } = 20;
        public bool turnedAround { get; set; } = false;
      }
-
QuarterGaugeFillChart -> is a class with which you can use gauge charts to display the point on the map. The QuarterGaugeFillChart class defines a set of gauge chart elements that are scalable with the zoom level and are only displayed in the current view.
public class QuarterGaugeFillChart : IQuarterGaugeFill {
    public int dimension { get; set; } = 40;
    public VisibilityZoomLevels visibilityZoomLevels { get; set; }

    public object paramOrValueStart { get; set; }
    public object paramOrValueStop { get; set; }
    public object paramOrValue { get; set; }
    public object paramOrIndexQuadrant { get; set; } = 3;
    public int heightCrownOuter { get; set; } = 8;
    public int heightCrownInner { get; set; } = 10;
    public string label { get; set; } = "Gauge Fill";
    public string fillPanel { get; set; } = "yellow";
    public double opacity { get; set; } = 0.6;
    public int fontSize { get; set; } = 5;
    public string fillingColor { get; set; } = "red";
    public bool haloText { get; set; } = false;
}
❗ Limitations of DynamicPointSVG, PieChart, GaugeChart and QuarterGaugeFillChart:
When using @using static MapsForBlazor.techs.maps.Leaflet it will not be displayed in Layers List control.
- SetPopup()
Another category of properties related to the appearance of the point on the map refers to the Popups associated with it (SetPopup()).
    public class Popup
    {
        public string content { get; set; } = "without content";
        public string title { get; set; } = "without title";
    }
Appearance settings can be cascaded (one after another, on the same Appearance filter):
   await map.Geometric.Points.Appearance(e => e.type == "A" || e.type == "B")
    .SetStyle(new PointStyle() { radius = 14, color = "green", fillColor = "azure", weight = 4 })
    .SetPopup(new Popup() { content = "<h4 style = 'background-color:gray;color:orange'>Text on popup</h4>", title = "titlu"});
Other examples:
-
No filtering (the entire
StreamPointcollection will have the same Appearance):await map.Geometric.Points.Appearance() .SetStyle(new PointStyle() { radius = 14, color = "green", fillColor = "azure", weight = 4 }) .SetPopup(new Popup() { content = "
Text on popup
", title = "titlu"}); -
Contained in an Array (Contains clause):
string[] types = new string[] { "A", "B" }; await map.Geometric.Points.Appearance(e => types.Contains(e.type)) .SetStyle(new PointStyle() { radius = 14, color = "green", fillColor = "azure", weight = 4 }) .SetPopup(new Popup() { content = "
Text on popup<
", title = "titlu"}); -
SetLabel()
The SetLabel() method provides the ability to add text to the map. The text will be associated with a StreamPoint
 await map.Geometric.Points.Appearance(e => e.type == "Industrial")
.SetStyle(new DynamicPointSVG()
{
    dimension = 20,
    scaling = 100,
    htmlContent = "<defs><radialGradient id='grad6' cx='50%' cy='50%' r='50%' fx='50%' fy='50%'><stop offset='0%' stop-color='red' /><stop offset='100%' stop-color='orange' /></radialGradient></defs><polygon  style='fill-opacity:0.42;stroke:red;stroke-width:2' points='20,20 40,30 50,10 60,30 80,20 70,40 90,50 70,60 80,80 60,70 50,90 40,70 20,80 30,60 10,50 30,40' fill='url(#grad6)'  />",
    title = "Parks",
    visibilityZoomLevels = new VisibilityZoomLevels() { minZoomLevel = 8, maxZoomLevel = 10 }
})
.SetLabel(new Label() { title = "Ind etichete", text = "Type: ${type}\n${value}", xyAnchor = new double[2] { 0, 0 }, font = new Font() { size = 12, family = "veranda", weight = "normal" } });
| ᶜ⁴ˡᵘ⁷ᵘ⁵ᵘᶠˡᵉ⁷⁸ᵘⁿ |
|---|
 |
Laurentiu Ichim, Bucharest